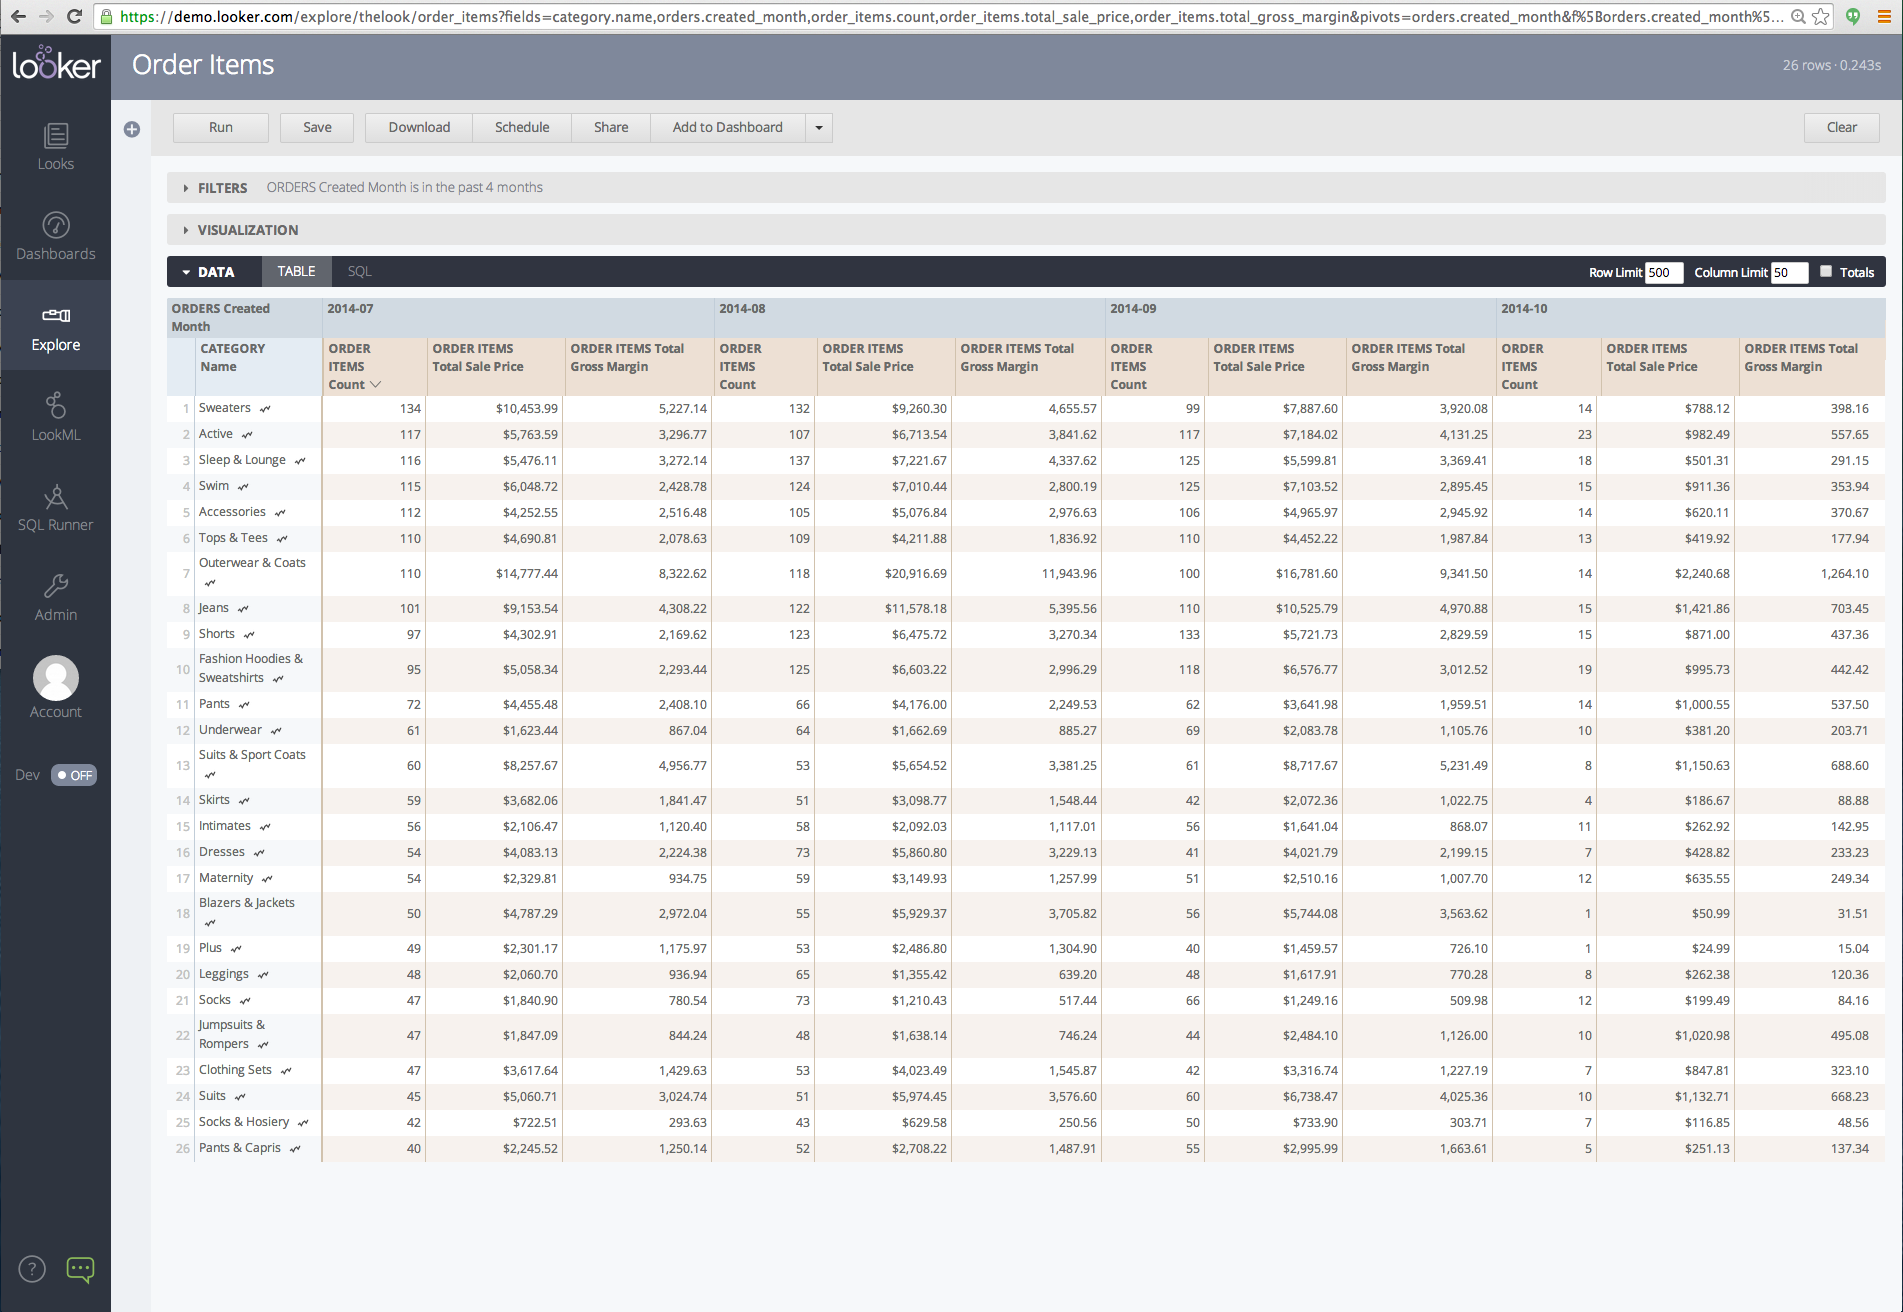
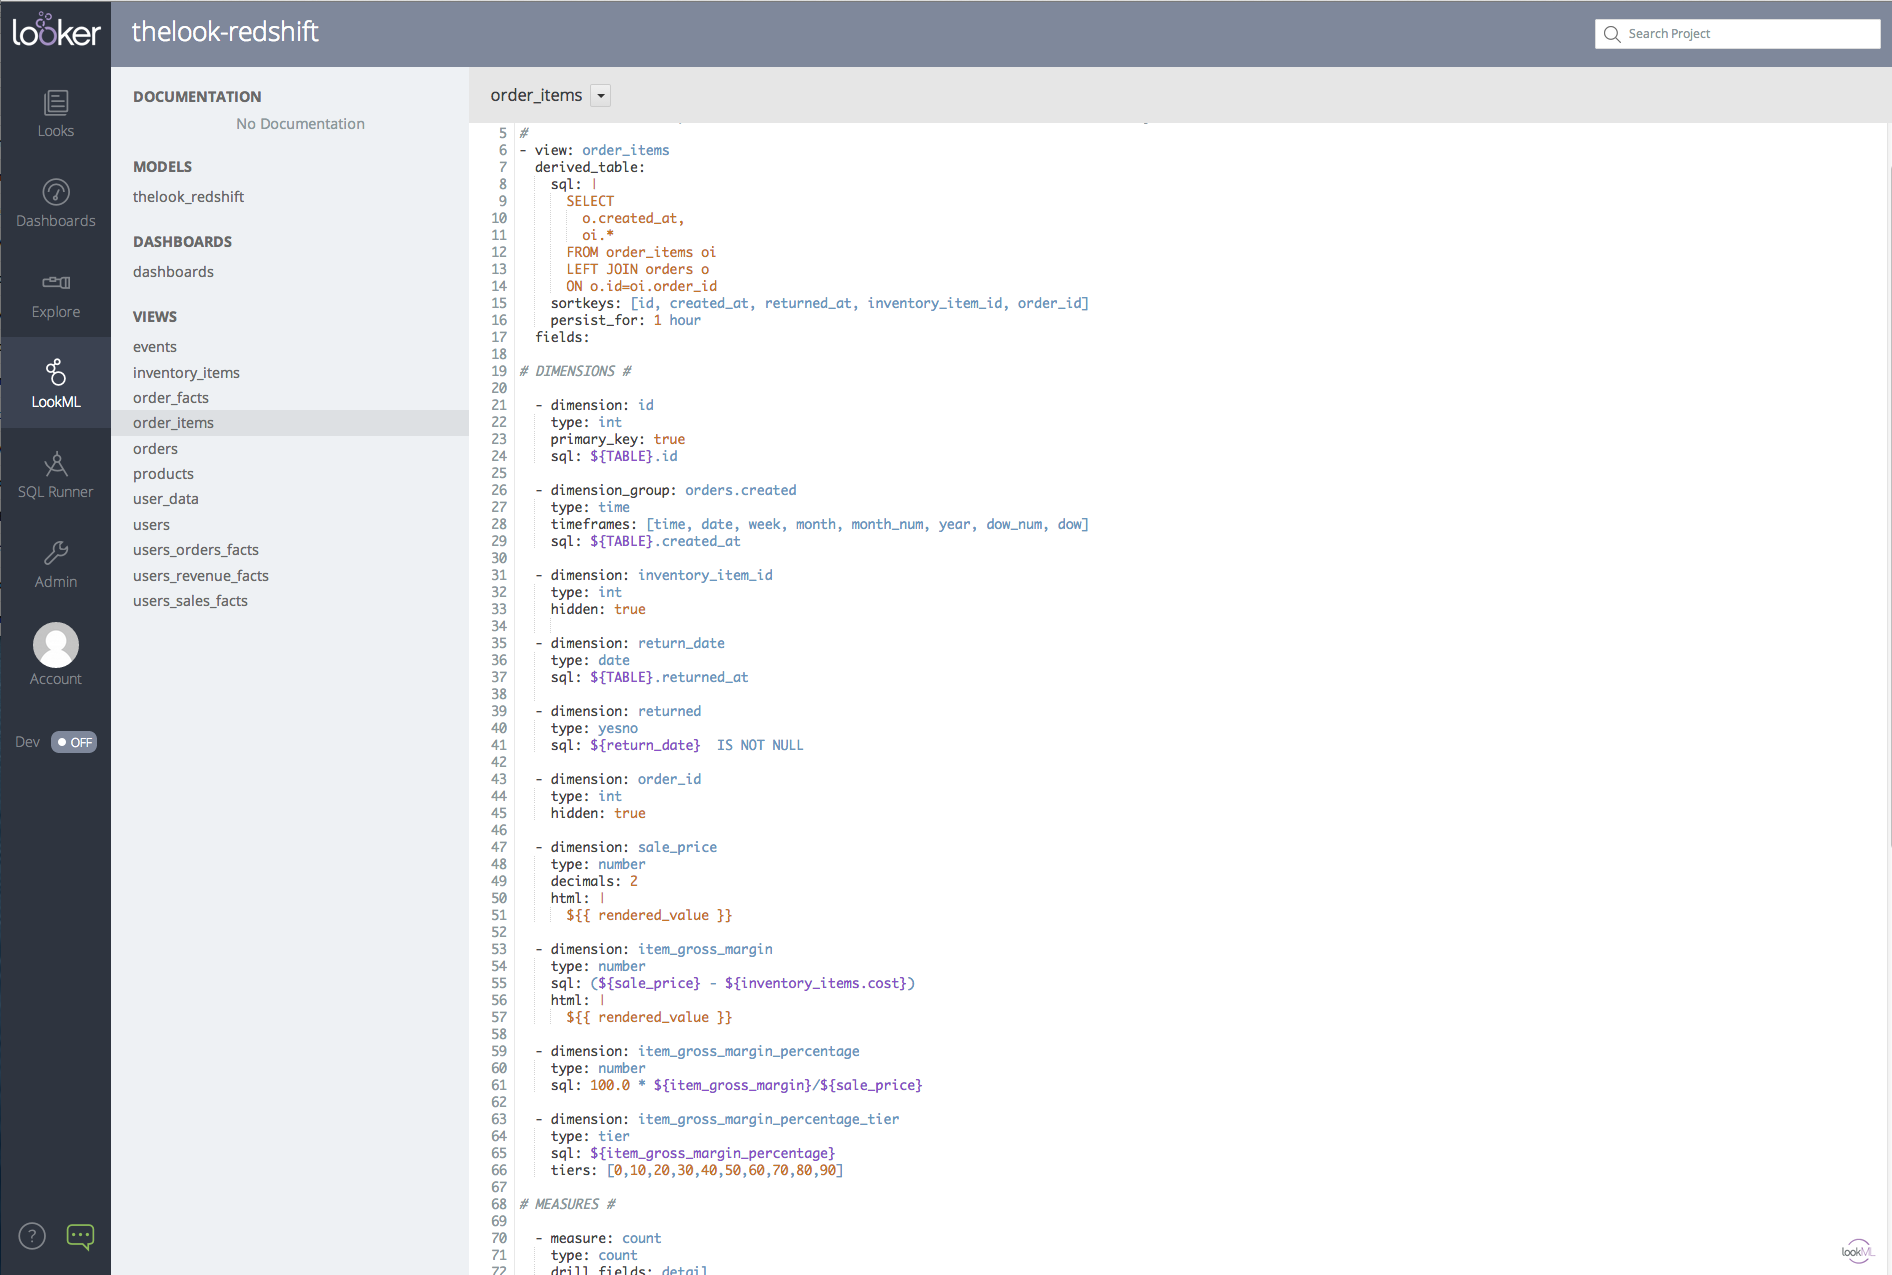
You can essentially create new data tables by pulling data from tables in your database and manipulating the data in the exact way you want. If you don't have the simplest or cleanest database structure, this is a life saver. Looker did a great job of joining all of our data from the hundreds of MySQL tables we have due to the automatic structure that our Drupal system creates.
Looker's support team is great as well. Always available on chat and will resolve any questions or errors quickly and completely. The implementation process was pretty fast for the complexity of understanding our database structure and creating a model in Looker that met our basic needs and that we could expand on. All the way from the sales to the implementation to the customer support team, Looker wants to make sure you are taken care of. Review collected by and hosted on G2.com.
Only connectors available are for data warehouses (MySQL, Redshift, etc.), not for outside sources of information such as Google Analytics, AdWords, Facebook, Mixpanel, etc. So if you don't have those data sources in your own data warehouse, then you need to develop your own ETLs or pay for another service to bring those sources into your single point of truth database.
User interface is evolving rapidly, but still lacks more sophisticated graphing functions to show data in a way that is consumable and editable for business users. It is also difficult to share reports with business users inside Looker because all of the variables are listed in alphabetical order and there isn't a way to organize them in groups etc. Due to these three issues I usually share my reports in Google Sheets (which it does have an auto export to) and aggregate and join outside data sources there. Review collected by and hosted on G2.com.
Video Reviews
1,492 Looker Reviews
Google Cloud stands "tall" & proximity for the cutting-edge strong innovation enterprise integration with various services in Artificial Intelligence & Machine Learning intricacies, & data analytics capabilities with the services spanning across BigQuery, Cloud Functions, Google Kubernetes Engine, Google Workspace & Firebase etc.
There are enormous features - ease of use & implementation, user-friendly interface, & frequency of use is high due to the versatility of the platform in handling sophisticated workload, orchestration, data analysis, serverless computing, & customer support centric oriented with high-level documentation. Review collected by and hosted on G2.com.
Google Cloud could benefit from enhanced compatibility with legacy systems & non-Google applications, particularly by simplifying the process of custom configurations.
As a leading force in the cloud space, Google Cloud demonstrates innovative growth, a strong customer-centric approach, & a consistently reliable suite of products. Review collected by and hosted on G2.com.
I have been using them since their name has not changed. When the name is Google Data Studio, it is best for reporting and creating a dashboard within a few hrs.
You can easily integrate all the Google products like Search Console, GA4, Google Ads, etc.
And the implementation is too smooth while creating the reporting dashboard Review collected by and hosted on G2.com.
And there are some key points I dislike about that, you can not easily integrate other products' data, like Facebook ads.
And if you have the comparison while presenting, in one click, it will create discrepancies.
So, there is some reason for disliking Looker, and if it is refined, I would not think about for referring to other colleagues. Review collected by and hosted on G2.com.
I am using Looker Studio since last 1 year and I have created multiple dashboards for me and my organization.
The best thing about Looker according to me is the ease of setup.
And the second thing is the way it connects with multiple data types. You can integrate this with a lot of data platforms.
You can create visually appealing and at the same time useful dashboards with this platform. Review collected by and hosted on G2.com.
Sometimes when you have multiple charts setup on the page some of your charts are loaded while the others don't load until you refresh the page in your browser.
I have experienced this while accessing the platform on Windows and also macOS. Review collected by and hosted on G2.com.
The Scalability of the Bi Tool, and Integration with GCP and other Cloud Platforms, and allow for customizable integration with websites, and creating application.
Also Integration with the BigQuery and Vertex AI Models allow for very cool features.
also the custom Graphs are very good, and Policies and data governance Review collected by and hosted on G2.com.
Lake of Documentation and guides, Most of the time i need to try till i understand how some features works. also sometimes the Integration with the Other GCP features and configuration is very vague, and with almost no documentation. Review collected by and hosted on G2.com.
Looker studio helps in connecting with major data sources to create a data-visualization report with custom filters. It has blended data feature which allows to create a single table from different data sources especially like Google Analytics and Google Search Console. You can also create a customizable report and instantly create a new report with same metrics and dimensions just by changing date range. It's reporting helps to make data-driven decision making. Review collected by and hosted on G2.com.
Mismatched dimensions often cause errors when creating a data visualization report. Also, sometimes data does not refresh automatically so we need to connect again using data connectors. Lastly, partner connectors have limited connection availability and you may have to download CSV file to create a visualization report. Review collected by and hosted on G2.com.
It was a great experience using Google Looker Studio as it is not complex to a beginner like me.I feel like everybody in any domain can easily use and understand Google Looker Studio. And the best feature about the looker studio is its drag and drop interface, cloud platform, free access, real-time sharing and collaboration. I frequently use google looker studio as 1-2 project/assignments in a month. Review collected by and hosted on G2.com.
As the Google Looker Studio is amazing in so many specifications i find some difficulty in data processing capacity. Review collected by and hosted on G2.com.
Looker is a very useful BI tool and easy to use. Ease of integration It integrates with various cloud data sources, Frequency of use is very nice, and it is ideal for daily task use. Looker is also very useful for customer support for creating good data with visualization. Ease of implementation is also great in Looker. I Like using Looker for my Data Analytics work. Review collected by and hosted on G2.com.
Sometimes setting up Looker and learning ML is challenging, especially for unfamiliar terms. Looker is good, and I like it very much. I don't have any dislikes. Review collected by and hosted on G2.com.
If I had to pick one standout feature, I'd say it's their data and AI capabilities — things like BigQuery for insanely fast data analytics, Vertex AI for building machine learning models easily, and overall how Google Cloud makes working with massive data sets feel way less painful compared to some other platforms. Review collected by and hosted on G2.com.
How complex and fragmented it can feel — especially for new users.
Like, they have amazing products, but sometimes the documentation assumes you already know a lot. Review collected by and hosted on G2.com.
As a Google Cloud Administrator with two years of hands-on experience, I've had the opportunity to delve deep into the world of cloud computing. Working with Google Cloud Platform (GCP) means always being at the forefront of technological advancements, offering robust solutions that scale seamlessly with business needs. The suite of tools available, from BigQuery to Kubernetes, is extensive and powerful, supported by a vibrant and helpful community that makes problem-solving a collaborative effort. The dynamic nature of cloud technology ensures there's always something new to learn, though the vast array of services can be overwhelming for newcomers. Keeping track of costs and optimizing spending requires constant vigilance, and mastering GCP's full potential demands significant time and effort. While rare, service interruptions can impact critical operations, and some areas of the documentation could be more detailed and user-friendly. Review collected by and hosted on G2.com.
As a Google Cloud Administrator with two years of experience, I've found that navigating the vast array of services can be quite overwhelming at times. It requires constant vigilance to manage costs effectively, and the steep learning curve demands significant time and effort. Occasionally, there are impactful downtimes that can disrupt operations, and some areas of the documentation could definitely use more detail and clarity. Despite these challenges, the role is incredibly rewarding and offers continuous opportunities for growth and learning. Review collected by and hosted on G2.com.
Effortless reporting with built-in metrics and dimensions, seamless data import from various sources via inbuilt APIs, easy sharing options, excellent visualizations, and insightful graphs, bars, and columns with date range filters for beautiful insights Review collected by and hosted on G2.com.
Bug Error with Data Blending:
Occasionally, when blending data in a table, a bug displays "RESERVED_TOTAL" in a dimension, causing other rows to disappear.
For more details, refer to this discussion: Looker Studio Community - RESERVED_TOTAL Issue. (https://www.googlecloudcommunity.com/gc/Looker-Studio/Random-RESERVED-TOTAL-grouping-when-using-GA4-live-connector/m-p/821696)
Quota Error:
At times, data tables or metrics show a "Quota Error," causing data to stop displaying.
A quick refresh often resolves the issue, and the data reappears.
Data Blending Limitation:
Looker Studio allows merging or blending a maximum of five tables or datasets into a single table. Blending more than five tables is not supported.
Unknown Errors:
Occasionally, an unknown error occurs, preventing data from displaying. However, refreshing the page generally resolves the issue and restores the data.
If you encounter issues with data visualization, try refreshing the page as a first step. Review collected by and hosted on G2.com.


